The concentration data are given in normalized form according to
with
c+ normalized concentration [-]
cm measured concentration [-]
H building height [m]
UH wind velocity at height H [m/s]
Ql emission rate of line source [m2/s]
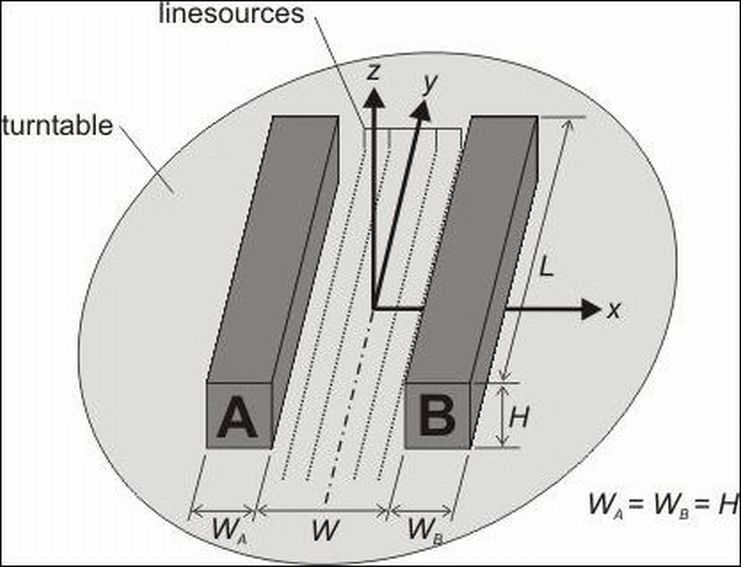
The normalized concentrations c+ have been measured at positions x+ = 0.04167 x/H in front of wall A respectively wall B.
The data files (see Data base) containing the concentration data are structured as follows:
| column#1 | column#2 | column#3 |
| y-coordinate | z-coordinate | y-coordinate |
| y+ = y/H | z+ = z/H | c+ |
| ... | ... | ... |
| ... | ... | ... |
| ... | ... | ... |
Remarks:
Each data file contains a number of 700 grid points. There is always one file for wall A concentration data and one for wall B (see Data Base)
For wind directions 90° (perpendicular to street axis) and 0° (parallel to street axis), the symmetric boundary conditions with respect to
x-z-plane and y-z-plane, respectively,
have been utilized. However, in order to assure a higher measurement data quality, concentration measurements at both symmetric positions have been performed.
The concentration data given in column#3 is the mean concentration of both